Sunday, April 30, 2017

My day with IceBridge

I've spent the better part of the last two years analyzing data from NASA's Operation IceBridge, a multi-year mission to collect data over both the arctic and antarctic using several instruments mounted to some futuristic-looking custom planes. I was trying to determine how much snow falls across Greenland during the past few centuries using IceBride's Accumulation Radar. I then compared these rates with state of the art climate models across the ice sheet. You can read the abstract, look at the pretty pictures, and skim through the paper here (for free)!

After countless hours analyzing IceBridge data, I was excited when I learned they were spending a few weeks based in Kangerlussuaq flying around the Greenland Ice Sheet. I quickly emailed the project manager to ask if we could meet up for coffee to talk about the mission, but he invited me to join the mission to fly on the plane for a day. I was ecstatic.

After a brief 15 minute safety video (slightly more entertaining than the safety videos on United Airlines) and medical forms, I was allowed to tour the plane and see the instruments.
Stepping onto the P3-B IceBridge airplane

Racks of computers and hard drives collect and store the data inside the fuselage

It took a while to warm up the instruments, check that everything was working properly, de-ice the airplane, and get clearance for takeoff (the Kangerlussuaq airport is surprisingly busy since it flies to Copenhagen and many small Greenlandic villages). We were heading for the Penny Ice Cap on Baffin Island (Canada) to measure the thickness and elevation of the ice cap, take pictures from the bottom of the plane, and calculate the amount of snowfall across the glacier. We flew across the sea ice of Baffin Bay until we started to see gigantic granite cliffs rising from the sea.

Mountains rising out of the sea ice at the eastern edge of Baffin Island

A glacier flows down one of many valleys

Large cliffs dominate the fjords around the edge of Penny Ice Cap
I see why Baffin Island has some of the best (and least explored) rock climbing in the world

Crevasses form in a glacier as it flows across a steep section of rock

The Penny ice cap with mountains rising in the distance

After taking in all the spectacular scenery, I tried to learn a bit more about how each of the instruments work. IceBridge carries 4 laser altimeters (to measure the height of the ground surface directly below and slightly to the side of the airplane), 5 radars (to see the top 20, top 300, and total thickness of the ice sheet), a gravimeter, magnetometer, and various downward mounted cameras to photograph the ice sheet. Using a fancy kinematic GPS the airplane's position and tilt/roll/yaw are known precisely with astounding accuracy. Pilots steer the plane according to predetermined flight paths 1500 m above the ground using iPad-like-devices that look more like a videogame than an instrument you'd find in a cockpit.

I was very excited to be able to fly with IceBridge for a day and learn all about how they operate. I'm continually impressed by the amount of data they are able to collect during each field season, and the quality of each instrument. Hopefully I'll be able to fly with them again soon.

Scientists control various instruments towards the back of the plane

The pilots look out over the sea ice in Baffin bay

Wednesday, April 26, 2017

We made it to Kangerlussuaq!

Yesterday HP, Forrest, and Tate flew from New York to Kangerlussuaq, Greenland. This is the first time that we are all together as a team!

Our flight to Kangerlussuaq was on a C-130 plane with skis
Karina trying to stay warm and catch up on sleep during the plane to Greenland
The traverse team consists of Karina Graeter and Gabe Lewis from Dartmouth College, Tate Meehan and HP Marshall from Boise State, and Forrest McCarthy (an all star mountaineer and safety rescue guru). A few weeks into the traverse, HP will be leaving and Bob Hawley (also from Dartmouth) will join us out on the ice for the remainder of the campaign.

Today we got busy with traverse preparations. The morning started out with a snow mobile and generator maintenance meeting. We are taking 5 snowmobiles out onto the ice with us. Three are 2-stroke machines (older and more powerful, but not comfortable to ride), and two are 4-stroke machines (newer, more fuel efficient, but complicated to fix if they brake down).
Forrest and HP taking a look at the snow mobiles. HP is working on mounting the ground penetrating radar antenna to the side of this snow mobile.

We spent the rest of the day organizing our gear. Polar Field Services did an awesome job getting much of our gear ready for us and storing items from last season. We set up and double checked all of our tents, sleeping cots, stoves, and kitchen gear. Tate and Karina washed up all the cookware, dishes, and tables to get them ready for the ice after they collected a bit of dust this winter. We organized our food into boxes to take with us at the beginning of the traverse and three cache sites (at Cores 9, 12, and 15) to be dropped off with extra snowmobile fuel next week. We hid Poptarts in each cache box so that we don't eat them all during the first week!

Some of our gear in the warehouse
Gear allocated to us by Polar Field Services including tents, cots, survival kits, medical kits, and tarps among many other items.

Tate and Karina washing the kitchen tables

Over the next few days we plan on packing up all our gear onto the ten (ten!) sleds we will be pulling alongside the two safety pods. We want to make sure that we can securely and neatly pack up all the science gear, personal gear, food, and fuel we will need for the next two months. Additionally, we will have meetings about safety and communication check-ins. If everything continues to run smoothly, we should have a day to rest up before heading up to Summit Station on May 1st!

We'll keep you updated on how the preparations progress!

Wednesday, April 12, 2017

2017 Field Itinerary

It's been a busy few weeks here at Dartmouth prepping for the 2017 field season. Karina and Gabe spent a few hours at BJ's and Hannaford's buying all the food for 5 people for 8 weeks on the traverse, then many more hours repackaging and sorting everything so that we minimize the amount of time we spend looking through the bins for pancake batter on storm days. We made sure to buy twice as many Poptarts as last year, so we shouldn't have a shortage this time!

Karina holds the receipt and shows off all the food we purchased at BJ's, doesn't it look healthy!

We tested the GPSs, radar systems, ASD albedo measuring device, new laptops, satellite internet connection, satellite phones, and Karina's new Canada Goose jacket (all the old ones were way too large for her).

Gabe got some funny looks testing the satellite internet outside of the Earth Science building as class was just letting out

Over the winter, Gabe worked on a paper calculating accumulation across the interior of the Greenland Ice Sheet based on airborne radar from NASA's Operation IceBridge. After publishing the study (link here) we realized there was a large gap between the coastal weather stations and regions where airborne radar could calculate accumulation. We decided to traverse through this gap to take the most useful measurements.

2016 GreenTrACS traverse (blue) and 2017 route (red) on top of a NASA Operation IceBridge accumulation radar measurements 
During the 2017 field season, we will snowmobile clockwise from Summit, Greenland (where we finished our 2016 traverse), along a 1200 km main traverse path, with an additional 1200 km of E-W spur radar lines. Karina and Gabe plan to drill 9 ice cores (hopefully 20-30 m deep again this year), while Tate, HP, Bob, and Forrest collect radar measurements. Gabe received another grant from ASD to bring a FieldSpec4 to measure albedo, and Bob has promised to fix the downward looking laser to measure surface roughness before the start of our traverse.

Karina and Gabe will fly to Kangerlussuaq on 4/18 to prepare. On 4/25 Tate, HP, and Forrest will join in Kanger to prepare for the traverse. The entire team will fly to Summit on 5/1 and spend a few days acclimatizing and testing all the scientific gear in the very cold conditions.

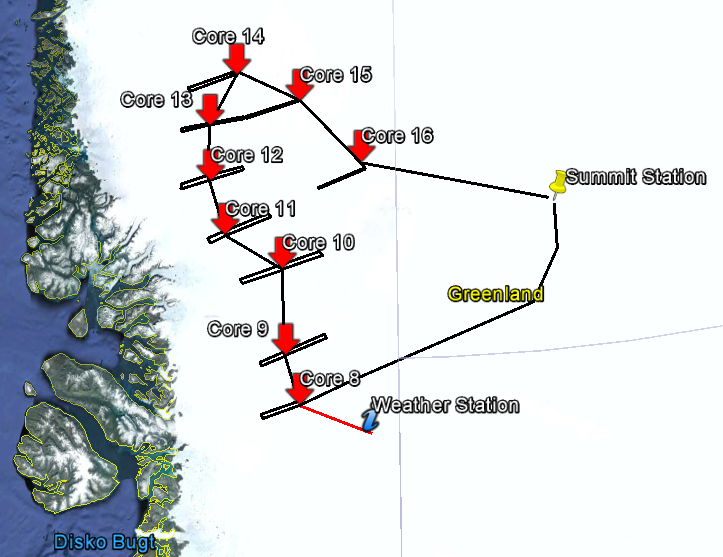
A detailed view of the 2017 field traverse

We'll spend a few days snowmobiling from Summit to Core 8, trying to maximize the radar data quality along this ~400 km section. Once we all reach Core 8 the real science begins. Karina and Gabe will drill their first ice core together, a team will drive west to collect radar measurements, and someone will return to Core 7 to collect the weather station we left there last season.

Bob will fly to Greenland April May 15 and join the rest of the team a few days afterwards. He will bring news from the states, fresh vegetables, and hopefully a birthday cake for Gabe! HP will then fly back to Idaho to resume his teaching and research responsibilities.

Just as last year it will take a few weeks to work out all the kinks and begin to click together as a team, but we are all looking forward to the science and opportunities we'll have this season.

Case Study: Is Greenland Getting Darker?: National Science Foundation-Sponsored Research Project Uses ASD Instruments to Measure Climate Change

Full article at https://www.asdi.com/learn/resources/application-notes/case-study-is-greenland-getting-darker-national

Written by Melissa Christensen, ASD


Case Study: Is Greenland Getting Darker?: National Science Foundation-Sponsored Research Project Uses ASD Instruments to Measure Climate Change

Challenge:

The Greenland ice sheet has experienced a recent period (since ~1990) of accelerating glacier melting, causing global sea level rise. Along with warming Arctic temperatures, Greenland’s melting may have been enhanced by a darkening snow surface, but scientists haven’t been able to determine if, and why, Greenland’s snow is getting darker due to the expense and difficulty of getting researchers out in the field. A darker snow surface absorbs solar radiation more quickly, warms up, and causes melting. The necessary research would focus not only on how much snow is falling, but also where it’s snowing, how much snow is melting, and whether and why the snow surface is darkening. The end goal is to determine how far sea level will rise in the next few decades to centuries, threatening many of America’s major coastal cities.


Solution:

In 2016, a collaborative research group from Dartmouth College, The University of Maine and Boise State University, Idaho, sponsored by the National Science Foundation (NSF), began studying the recent changes in surface mass balance on the western Greenland ice sheet percolation zone. The research project includes two field seasons snowmobiling ~3000 km across Greenland to investigate how the massive ice sheet is changing and why.

In order to gather crucial data, Gabriel Lewis, Dartmouth College Ph.D. candidate, wrote a NSF Graduate Research Fellowship grant, as well as a Goetz Fellowship Grant from ASD, to borrow an ASD FieldSpec® 4 spectroradiometer and was awarded temporary use of the instrument for both field seasons.

“We knew we needed to measure albedo to find out if Greenland is getting darker as a result of more impurities from fossil fuel pollution in the snow, or if the darkening is from larger snow grain sizes from warmer temperatures, or if the satellite measurements are falsely indicating a darkening ice sheet,” said Lewis.

Lewis chose the ASD FieldSpec 4 because:

Unlike other spectroradiometers, the FieldSpec 4 can measure albedo (the ratio of incoming and outgoing radiation of the snow) at multiple frequencies (in this case, 350-2500 nanometers with high resolution and accuracy) for a more complete picture.

The FieldSpec 4 can also be used with a contact probe to measure the optical grain size of snow grains – a vital piece of information to determine if the snow has darkened.

The instrument is portable, making it easy to transport and use in the field.

The instrument came highly recommended by engineering colleagues at Dartmouth College.

The FieldSpec 4 instrument was used to measure albedo, as well as the optical grain size of the snow. Additionally, samples of snow were collected and analyzed to measure their dust and soot impurities. Through laboratory analysis back at Dartmouth, the group was able to measure the quantity of impurities, their origin and whether their creation was natural or man-made.


Results:

Though the research project has yet to be completed, the preliminary results exhibit a statistically significant correlation between the snow grain size and albedo, and no statistically significant correlation between the impurities and albedo. There is great agreement between the NSF-sponsored research project’s measurements and both NASA satellites and computer climate models. Most of the measurements fall within the expected uncertainty from the samples and locations processed so far and the team is eager to collect more data.

“It’s great to know we are on the right track. I am very excited to take the FieldSpec 4 back into the field this spring and expand on some of the correlations we’ve already noticed,” commented Lewis. “From my work last summer, it is clear the ASD FieldSpec 4 albedo measurements in Greenland agree nicely with many of the satellite and climate model measurements -which is wonderful.”

In April 2017, Lewis and his team will return to Greenland to gather additional measurements over the course of eight weeks. From there, the final research data will be compiled to determine whether or not current climate models need to be altered to better predict the future of the Greenland ice sheet, including what is specifically causing the snow to melt or become darker (e.g. grain size, pollution, warmth, etc.).

Lewis concludes, “climate change is not up for discussion. It is real. It is happening, and we have all the data to prove it. The data I am helping to gather and analyze will help us understand the impact of climate change on Greenland, and what it means for the future of the planet.”


Tuesday, April 11, 2017

Preliminary results from 2016 traverse

Albedo

During the 2016 field season, we measured broadband albedo (from 350-1800 nm) at 35 locations totaling 373 measurements. Likewise, we measured the snow's optical grain size and collected snow samples to determine impurity concentrations from both mineral dust and black carbon.

We compared our albedo results with the MODerate resolution Imaging Spectoradiometer (MODIS) satellite and Modele Atmospherique Regional (MAR) climate model. In the map below you can see the differences between our measurments and the satellite/climate model outputs.


Our albedo measurements agree with MODIS within their reported error, although differences from the MAR climate model are a bit larger than expected. 


   MAR
MODIS
RMS difference from measurements 
   0.045 ± 0.039
0.029 ± 0.029
Reported error
   ± 0.02
± 0.067


We see a negative correlation between optical grain size and albedo (R2 = 0.845, p = 0.005), as would be expected, but no significant correlation between total impurity mass and albedo (R2 = 0.0003, p = 0.96). These results agree with previous studies, which conclude that snow grain size can be 5-10 times more important in albedo reduction than black carbon content or density (Adolph et al., 2016; Tedesco et al., 2016).


Firn Cores

In the 2016 traverse we successfully collected seven firn cores, each ranging 21 - 31 m in length. Each firn core was analyzed for density and the distribution of refrozen melt. Portions of all 7 cores were melted for major ion, trace element, and water isotope samples. We are currently measuring and analyzing these samples to determine annual accumulation from each core. Core 2 provides an example of these results:

The graph below shows annual accumulation measured in Core 2 and the annual accumulation measured in PARCA core 6745. While the two cores have a similar mean annual accumulation, the year to year variability does not agree well between the two cores.

The Core 2 annual accumulation does agree well with several regional climate models. Pearson correlation (R) values are: RMAR = 0.57, RRACMO2 = 0.64 , RPolarMM5 = 0.57 and RBOX13 = 0.51


Melt Refreeze

We documented the location of melt refreeze features, such as ice layers and pipes, within each firn core using a backlit light table. We then analyzed the distribution of whole ice layers vs depth. We plan to analyze the distribution of ice layers with time once we measure the annual accumulation for all seven cores.

We found a significant increase in the total amount of ice in ice layers with decreasing depth for cores 1 to 5 (p-values < 0.02). Core 6 shows an insignificant increase in the total amount of ice layers in the firn and core 7 shows no trend. This suggests that, for the lower elevation sites, the changing summer climate over this region and increasing surface melting are resulting in greater amounts of refreezing within the firn, which has important implications for estimates of Greenland surface mass balance. 


Radar

We collected a total of 1630 km of ground penetrating radar during the 2016 campaign from Raven/Dye-2 to Summit, 800 km were along the main traverse path and 830 km were along the E-W spurs.

Preliminary analysis from the 400 MHz antenna along the main traverse path show excellent agreement with climate models. We see much more spatial variability from our radar accumulation results than the climate models indicate. It will be interesting to see how well our results compare with the climate models for the E-W spurs and for the 2017 traverse.